March 2025 Feature Update: Smarter Risk Management & Trade Tracking with Quantman
Introduction
In the world of trading, every second matters. The ability to make informed decisions quickly can be the difference between success and missed opportunities. At Quantman Algo Trading Platform, we constantly attempt to make trading more efficient, transparent, and easy to understand. This March, we are introducing two features that will enhance your trading experience Drawdown Days (Backtest) Feature and Order-Type Badge for Recent Transactions & Deployed Strategies. These features will help traders analyze risk better, track their executed orders effortlessly, and improve their overall trading performance. Let’s take a closer look at how these features work and how they can benefit traders.
Drawdown Days (Backtest) Feature—A Better Way to Analyze Risk
Risk management is one of the most important aspects of trading. Every trader wants to understand how much their strategy can lose and for how long before it stabilizes. This is where Drawdown Days come in. Drawdown refers to the decline in trading capital from its highest point. Understanding how many days a drawdown lasts can help traders manage risk and choose better strategies.
How Quantman Calculates Drawdown Days
Quantman’s Drawdown Days (Backtest) feature calculates how many days a strategy stays in a drawdown phase before reaching a new peak. This helps traders understand the duration of losses in their strategies.
Below is an example of how Quantman displays drawdown days:
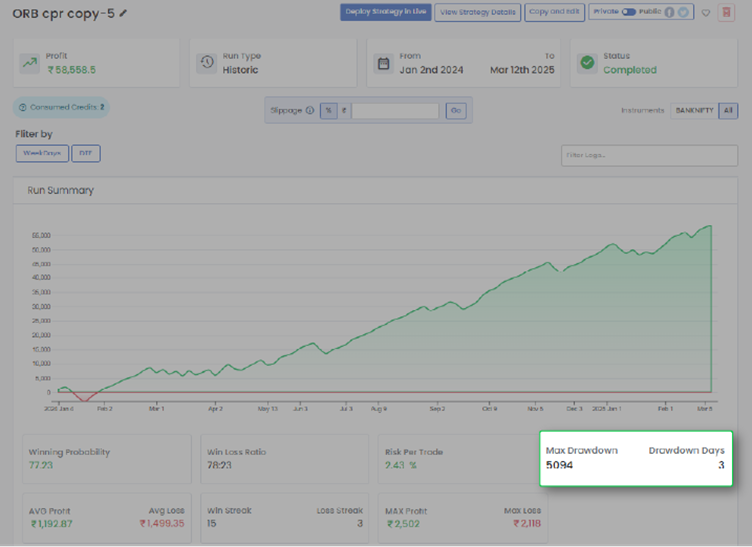
In this example:
- Max Drawdown: ₹5,094 This means the strategy experienced a maximum loss of ₹5,094 before recovering.
- Drawdown Days: 3 This shows that the strategy remained in a drawdown phase for 3 days.
How Drawdown Days is Calculated
Quantman calculates Drawdown Days using the following steps:
- Identify Peak Equity: The system detects the highest value of the portfolio before a decline.
- Measure Drawdown: If the portfolio’s value drops from the peak, Quantman records the loss.
- Count Drawdown Days: The system tracks the number of days the portfolio stays in a drawdown phase before hitting a new peak. These days are called Drawdown Days.
For example, if a portfolio enters a drawdown on Day 2 and remains in that phase until Day 5, the Drawdown Days will be 3 days (from Day 2 to Day 5). This does not mean recovery time it simply indicates how long the strategy stayed in a drawdown phase.
This feature helps traders evaluate strategies based on how long they experience drawdowns, improving risk assessment and capital management.
2. Order-Type Badge – Easy Tracking of Live and Backtested Trades
Managing multiple trades can be challenging, especially when you are running multiple algo strategies at the same time. One of the most common issues traders face is tracking whether their orders were placed in a live market or were part of a backtest or paper trade. To solve this, Quantman has introduced the Order-Type Badge for Recent Transactions & Deployed Strategies.
This feature ensures that traders can instantly identify whether a trade was executed in Live Mode or was just a Backtest or Paper Trade. The order type is displayed as a small badge next to each trade, helping traders quickly understand how the trade was placed.
Below is an example of how Quantman displays the Order Type Badge:
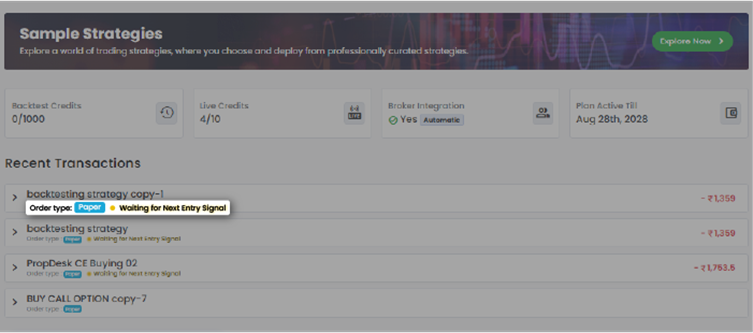
In this example:
- Order Type: Paper – This means the trade was executed as a paper trade or backtest, not in a live market.
How It Helps Traders
- Live Orders: If the order was executed in real-time with actual money, it will show Live as the order type.
- Paper Trades: If the order was executed in a simulated environment for testing, it will show Paper as the order type.
- Backtested Strategies: If the trade was part of a backtest, the badge will indicate that as well.
For example Imagine you are testing a new strategy and have both live trades and paper trades running at the same time. At the end of the session, you check your dashboard and see:
- A Live Order badge, meaning this trade was executed in the actual market with real money.
- A Paper Order badge, meaning this trade was just a simulated test.
This feature saves time and eliminates confusion, ensuring that traders do not mix up their live trades with backtested trades.
For options traders, these features offer additional advantages. The ability to see drawdown days helps in filtering out risky options strategies by showing over how many days the drawdown happened, ensuring traders deploy only the best strategies. Meanwhile, the Order-Type Badge provides real-time clarity on executed trades, preventing errors and improving overall trade tracking.
Algo traders managing multiple strategies will also find these features incredibly helpful. Since algo trading involves executing multiple trades automatically, having instant visibility into order types ensures that traders can quickly review their strategies and make any necessary adjustments. Drawdown Days analysis will further help in selecting strategies that align with a trader’s risk tolerance and profit expectations.
Conclusion
The March 2025 feature update on Quantman Algo Trading Platform is all about making algo trading simpler, smarter, and more effective. With the introduction of the Drawdown Days (Backtest) feature, traders can now analyse how long their strategies take to how many days the drawdown had happen, which is crucial for better risk management. On the other hand, the Order-Type Badge makes trade tracking effortless by giving traders an instant visual indicator of whether their trades were live or backtested.
At Quantman, we believe in empowering traders with the best tools to help them succeed in the markets. These new features will not only enhance risk assessment and trade execution but will also bring more transparency to algo trading. Whether you are an experienced algo trader or just starting, these updates will ensure that your trading decisions are backed by data and efficiency.
Stay tuned for more exciting updates in the coming months.
Happy Trading!